Increase Plant Profits by Process Monitoring and Optimization
Any factory or chemical plant has anywhere from about 10 to as many as several 1000 PID control loops. If PID tuning parameters are not optimal, control action can be slow or unstable and oscillatory. Bad PID control action can reduce product quality, make products sub-prime, off-spec, prevent production rate maximization, increase air pollution emissions, cause unplanned plant upsets and shutdowns, wear-and-tear on equipment, reduce life of control valves and moving machinery and distract the operators and engineers on focusing on other important tasks in the factory.
PiControl has developed two modern software for process monitoring and PID control optimization. APROMON monitors all PID control loops in the factory and PITOPS improves and optimizes the PID tuning for all PID control loops. APROMON is abbreviation for Advanced PROcess MONitoring and PITOPS is Process Identification and Controller Tuning OPtimizer Simulator.
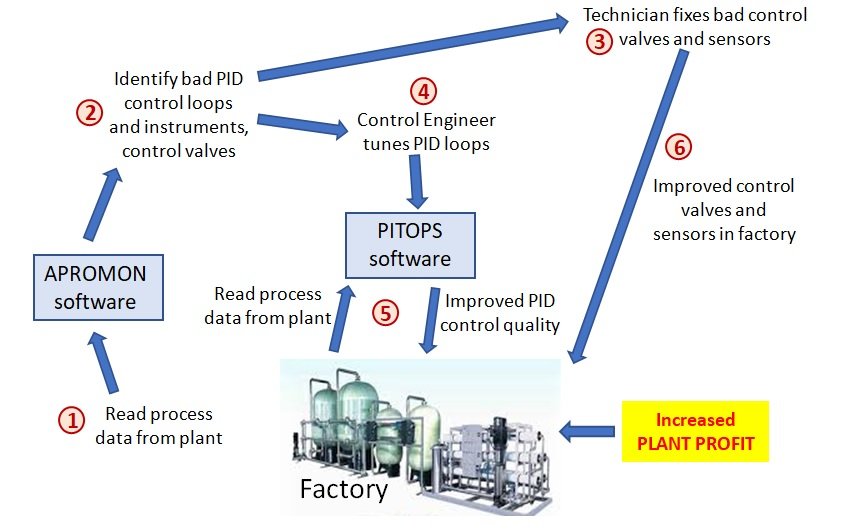
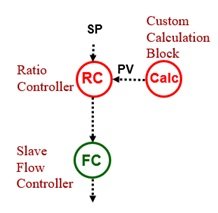
The use of APROMON and PITOPS is a must in any factory. Chemical plants, petrochemical plants, paper plants, pharmaceutical plants, polymer plants, electric power plants, boilers and utilities, oil refineries, automobile manufacture, food industry – all will benefit by the use of APROMON and PITOPS. Figure 1 shows the complete process how a plant can benefit. This document describes APROMON. Another document describes PITOPS.
Figure 1. Process Monitoring and PID Tuning Optimization in Factories and Plants
Process Control Monitoring
Industrial process control is an increasingly important area. It is a great area to run factories and manufacturing plants better and increase profit margins. This is critically important due to global competition. Manufacturing plants can have anywhere from as few as 5 to as many as 5000 PID loops depending on the size and type of the process. As time goes by, process dynamics, process conditions, goals and objectives of the plant can all change. These changes can impact PID control quality. PID control loops and APC (Advanced Process Control) systems need to be monitored. The control room staff cannot watch all controllers daily. Automatic online monitoring software is essential to monitor the performance and control quality of the PID control loops. Market research shows that less than 15% of plants use process control PID control loop monitoring software. A big opportunity to run plants better, more efficiently and increase profits is missed.
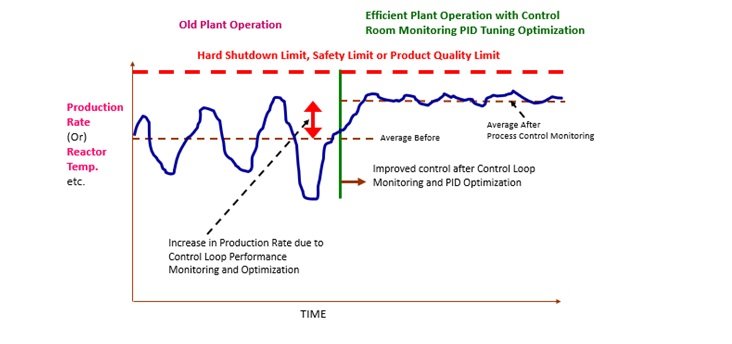
Process Control Monitoring (PCM) or Control Loop Performance Monitoring (CLPM) is a rising, new field. Plants can be run more efficiently with control monitoring tools. As much as $300K to $2million/year recurring savings can be realized by modern control monitoring. Addressing the needs of industry for practical, user-friendly, easy and convenient software, PiControl developed Apromon. See Figure 2 below.
Figure 2. Improve plant performance by PID control monitoring & PID tuning optimization
Overview of Apromon Functionality
Apromon is an online PID control performance monitoring software for chemical plants and oil refineries. Apromon is very practical and easy for both engineers and technicians in the control room. Apromon examines PID, multivariable PID, cascade and override PID control quality based on over 25 control and statistical performance criteria. Apromon can monitor as many as 1000 to 3000 or more tags in any plant using modern OPC technology or data from Excel files.
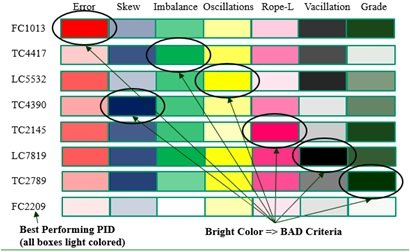
Apromon generates a report automatically everyday, sorting all PID control loops in the order of control quality. Apromon displays an online grade report and diagnostic messages for all PIDs in the plant indicating their health and control quality. Apromon can also be configured to send online email/text alerts when the control quality of PID control loops deteriorate. Apromon allows Control Engineers to quickly focus on the loops deserving the most attention. It helps to quickly identify control problems and to achieve faster restoration of process control and PID loop performance quality. Apromon helps plant operations personnel to focus on Proactive versus Reactive Maintenance, to promote taking faster action and avoid failure and shutdowns instead of waiting for things to fail and then react. Apromon reports many diagnostic messages and assists the control room engineer and technician tun the process better. Apromon reports the following:
Which loops are not controlling well?
Which loops are oscillating?
Which loops have matching frequencies?
Which control valves are not working well?
Which control valves are moving excessively?
Which loops need proportional adjustment?
Which loops need integral adjustment?
Which loops need derivative adjustment?
Which loops need filter adjustment?
What is onstream factor of the loops?
Which loops do the operators intervene most?
Which loops have instrument signal problems?
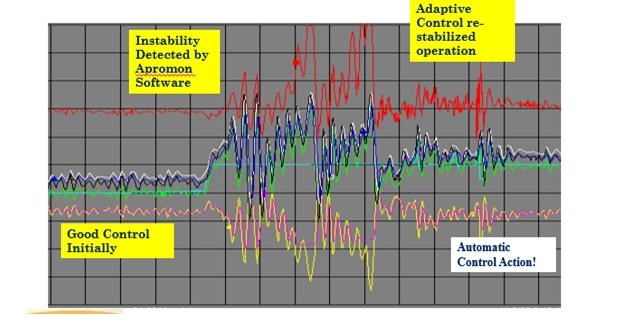
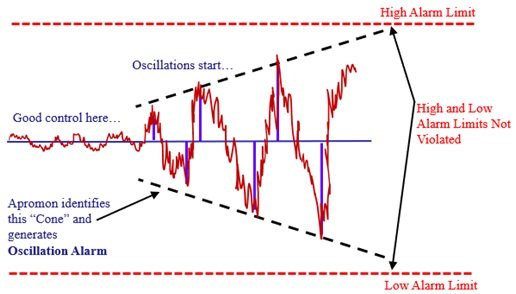
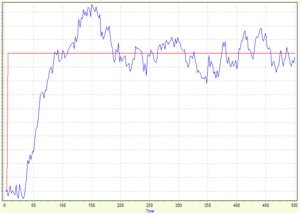
Figure 3 shows a real example in a manufacturing process. Oscillations start in the process due to unmeasured and unknown disturbances, equipment malfunction and were immediately identified by Apromon. Closed-loop Adaptive Control action snuffed the oscillations and restored good control again. A potential shutdown, process upset and lost production was completely avoided.
Figure 3. Automatic Adaptive Control Action with Control Performance Monitoring
Signal Validation and Alarming
Simple problems like sensor failure can be catastrophic in plants. No operator can be watching all signals, all sensors continuously. PV signals can freeze due to communication failure or sensor issues. A frozen signal will never generate an alarm and eventually a shutdown system trigger will prevent a hazardous operating condition.
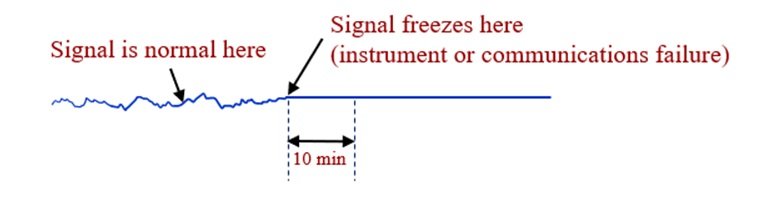
Apromon monitors all PV signals from DCS or PLC and will alert upon detecting frozen values and can avert a catastrophic shutdown. Savings US$150,000 have been seen by such monitoring of frozen signals. Without continuous automatic monitoring, operators would not know until much later when process upset took place. See Figure 4 below.
Figure 4. Frozen PV Signal Detection by Control Loop Performance Monitoring
In another example, a plant can lose production due to off-spec products because of mistakes made by DCS/PLC personnel. For example, during routine work, control engineers could modify calculation blocks in the DCS or PLC and leave them inactive by mistake, or some clamping could prevent necessary changes in the slave PID setpoints. See Figure 5.
The PV signal to some intermediate Ratio Controller or a Slave PID could be frozen. Such mistakes and problems are difficult to get noticed quickly. Such cases may never produce alarms. As production rates change, intermediate tags may be frozen and produce off-spec material. Losses of as high as US$750,000 can result and could be prevented by using Apromon process control monitoring software.
Figure 5. Monitoring of DCS tags & Logic
Control Valve Monitoring
Control valves are an expensive asset in a factory. They need to be monitored carefully. Control valve may be moving erratically like the one shown in Figure 6. Without control monitoring software, it is hard to know if control valves are moving excessively. A plant can have anywhere from 50-2000 control valves. Control valve will wear out fast if allowed to move excessively and cost the plant high replacement maintenance costs. Apromon identifies this problem and helps to run control valves. Apromon can be used to:
Identify Noisy PV signals
Advises you to put PV filtering
Warns of excessive Derivative action
Increases control valve life
Improves control action
Average savings US$275,000 per year
Figure 7. Optimum PV Filtering
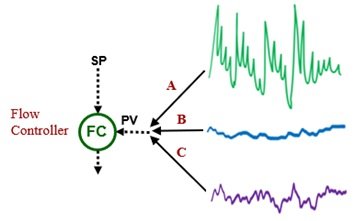
See Figure 7 . The top noisy signal is because the PV filter is zero. Without Apromon tool, no one saw any problem and no one added PV filtering.
The flatter signal in the center is due to erroneously excessively high PV filter. Someone may have added a wrong high filter and then forgotten about it. No one may detect this heavy filter ever and this will slow down control loop dynamics and can impact PID control quality, APC (Advanced Process Control) and MPC (Model Predictive Control)
Apromon helps to identify too little or too much filtering and helped to add just right PV filter, see the bottom trend in Figure 7.
Online Oscillation Detection
Oscillations are a big problem in all manufacturing processes using PID control in a DCS or PLC. Aggressive proportional gain or impatient integral tuning will result in PV and OP signal oscillations. Apromon is powerful and highly sophisticated for accurately detecting oscillations.
Chemical plant signals comprise of fast noise, slow drift and real process signal. Apromon has unique proprietary technology for identifying the true oscillation amplitudes. Other known technologies often get confused and generate wrong results. Apromon is equipped with unique, novel, proprietary oscillation detection algorithm called TAD – true amplitude detection. Apromon can precisely and unambiguously detect oscillations. Other algorithms generate a value 0 to 1 but do not clearly generate a YES/NO flag for oscillation detection. Apromon indicates a YES/NO clear oscillation detection diagnostic and can be used to generate automatic adaptive control action.
The True Amplitude Detection (TAD) Algorithm in Apromon is explained here. The TAD algorithm helps to very accurately determine which loops are truly oscillating. TAD allows various precision tuning parameters to customize each loop to catch oscillations very precisely. Irrespective of noise levels, squiggly data or filtering or any other signal characteristics, TAD provides the necessary handles to detect oscillations without getting confused. See Figure 8.
Figure 8. True Amplitude Detection for Online Oscillation Detection and Adaptive Control
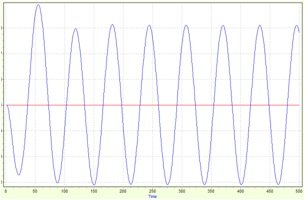
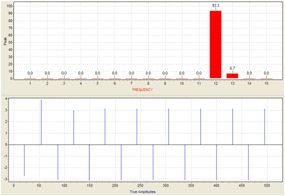
Simple oscillations as shown in Figure 9 below are easy to identify. In a perfect sinusoidal wave, there is a single dominant frequency. Apromon determines the single dominant frequency as shown by the single bar indicating one frequency.
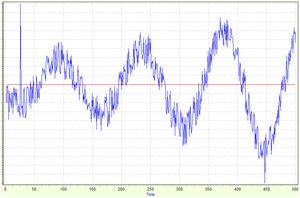
However, in industrial data, complex noise and unmeasured disturbances are always superimposed on the clean process signal. The signal in Figure 10 shows a noisy sinusoidal wave. This has a single dominant frequency, but also fast and medium noise frequencies.
Regardless of level of noise, drift and disturbances, Apromon can isolate the true oscillation and not confuse with the noise and “squiggles”. Other technologies get “confused” depending on the noise levels and frequencies.
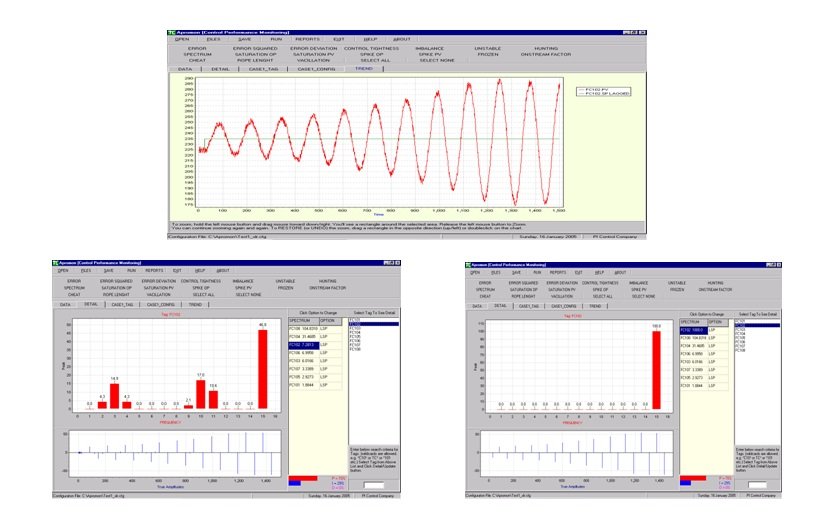
Apromon isolates the fast random (white) noise and drifts and unmeasured disturbances and generates the actual process signal upon which oscillation detection is performed. This functionality is extremely powerful and unmatched by other algorithms and produces very reliable online oscillation detection that can be safely used for providing adaptive control in a DCS or PLC. Figure 11 shows a sine wave with superimposed random (white) noise. This is simulated data to explain the power of Apromon’s online oscillation detection TAD algorithm.
Figure 11. Isolation of Noise and Detecting the Real Clean Sinusoidal Wave using Apromon’s TAD algorithm
The single red bar on right in Figure 11 shows Apromon’s ability to display the single dominant frequency of the real sine wave of interest. Apromon has detected the random noise and disturbances and eliminated them from the oscillation detection algorithm showing that a single frequency of oscillation exists.
Without this ability to isolate noise, drifts and disturbances, other technologies display additional red bars in the left figure above. The smaller left bars show presence of fast noise and medium frequency disturbances that are not important in the oscillation detection but generate false results and can generate false diagnostics. In this example, only the single bar, indicative of a single frequency in the example is important and Apromon precisely is able to generate this result.
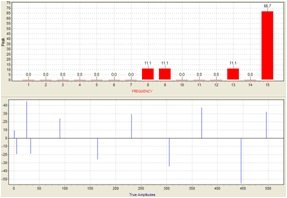
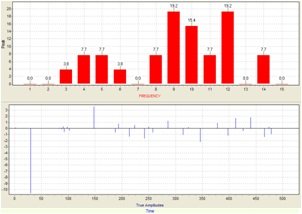
Setpoint Change Amplitudes
Figure 12 shows a Setpoint change. Control action is non-oscillatory, spectral distribution is diverse. The red bars show the frequency distribution and the thin blue bars in the plot below the red bars show the true amplitudes from the PV signal as seen during the Setpoint change. Notice the PV minus SP deviation in the left plot matches with the height of the thin blue bars showing the accuracy of the online TAD algorithm. Apromon identifies the diverse spectral frequency distribution as manifested by the several bars (true amplitude detection) poles.
PID Controller Modes
Apromon determines and alerts if PID control loops are often in Manual Mode, indicative of low onstream factor. It is important for the operations group in a plant to know if too many PID control loops are in manual if they are supposed to be in auto, or if too many PID control loops are in auto mode and they are supposed to be in cascade mode, if they are slave PID loops.
Apromon also reports if the operator is making too many mode changes from Auto to Manual and back to Auto. Or going from Cascade to Auto and back to Cascade. Such changes in mode may be a sign that the APC or MPC is not working well and the operator is often forced to intervene and assist the poorly functioning APC and MPC. Such functionality in Apromon helps to identify poorly controlling PIDs and poorly performing supervisory control systems including DCS-resident APC and MPC using DMC or RMPCT type controllers.
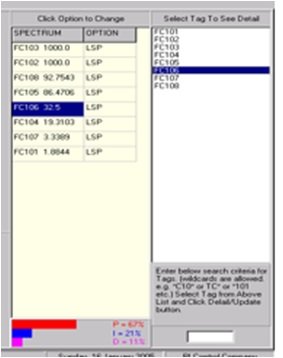
Breakdown of Individual P, I and D Contributions
Apromon is the only software that has a special algorithm to decompose the total control valve movement into individual P (proportional), I (integral) and D (Derivative) contributions. Apromon shows which of the three terms (P, I or D) is dominant and this helps to identify tuning problems followed by structured analysis to optimize and improve the PID control loop tuning. For example, a high value of P (proportional gain) does not necessarily indicate high proportional action as instrument range and transfer function can also cause the proportional gain to be abnormally high.
Simple, Practical- Designed for Control Room Environment
The biggest reason why control loop performance monitoring tools like Apromon are not very commonly seen in the manufacturing factory control rooms is that most tools are too complex, too confusing and not practical. They often produce false positives and miss true problems that need to be reported. In contrast, Apromon is very simple, user friendly and can be installed in just half a day by technicians and engineers with little or no help from PiControl. Advanced college education and extensive training on Apromon are not needed.
Other monitoring tools require 4 weeks – 6 weeks of installation time and training time. In contrast, Apromon can be installed in just half a day with minimal training on configuration, run-time diagnostics and interpretation training.
Apromon comes with just a short, concise 85-page user manual that explains everything from installation to commissioning and online use. Apromon is designed and developed with C++ code that has been built to be super-fast, super-compact, robust and easy to use.
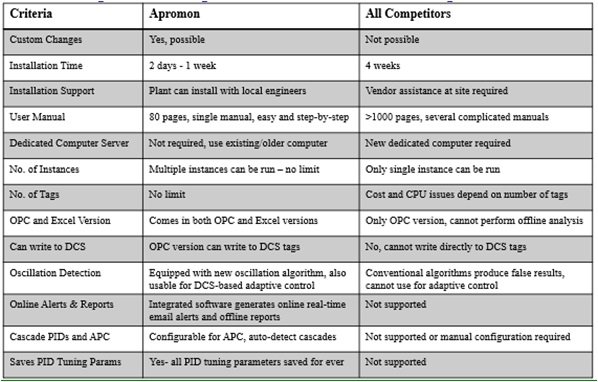
Uniqueness of Apromon
Figure 14 shows the uniqueness of Apromon and a comparison with other tools and technologies.
Figure 14. Apromon Comparison with Other Tools
OPC and Excel Option
Apromon is available in two forms:
◘ OPC version
◘ Excel version
With OPC, Apromon runs automatically and connects to any DCS or PLC using OPC DA (Data Access) OPC server.
With Excel, Apromon can read Excel/CSV file data generated by any plant historian (PHD, Pi etc.) and perform calculations offline.
Offline Reports and Online Alerts
Apromon generates detailed reports showing all criteria calculations for all PID every 24 hours, 12 hours or any frequency selected by the user.
Apromon also generates online alerts as soon as it detects a control problem. This online alert can be sent as an email or a text message to a smartphone of the support technician or control engineer. The various criteria calculations are listed in Figure 15 below.
Figure 15. Apromon Criteria Calculations
Value of Apromon and Benefits in Control Rooms
Apromon helps the plant operations group in several ways. Details are explained below:
Noisy PV signals
PV signals can be noisy for many reasons; most often because of the measurement technology and the underlying electronics. Noisy PV signals cause poor primary control, can harmfully impact advanced process control (APC) quality and also cause control valve wear and tear, resulting in damage and premature failure of control valves. Apromon can help to identify the noisy signals automatically and assist with a plan for improving the situation. Savings potential: US$200K.
Frozen PV signals
A plant has a large number of signals and it is impossible for a human to notice PV signals that are frozen at times or for extended durations. Bad resolution, range issues, wrong type of PV characterization, DCS attributes, bad I/O card, wiring problems, technician mistake or an instrument failure- all can result in a PV signal that is always frozen (fixed) or if frozen for some period of time. The PV may move a little sometime, but for some part could be frozen. Just a casual look at a signal like this may not alert any problem, but the detailed analysis by Apromon will flag the problem free and clear. Frozen signals can result to poor operation, bad control, and could even cause plant shut-downs or unsafe operating conditions. Savings: US$250K.
Dampened PV signals
Dampened PV signals are PV signals that are not moving as much as they ought to be. The real process is changing much more and the PV signal in the DCS does not change as much. This can be due to erroneously high PV filtering set in the DCS or PLC. Or it could be caused by some other wiring, instrument or characterization issues. Apromon will help to identify such problems.
Oscillatory PV signals
Oscillations in a PV signal are a common problem in the chemical industry. Oscillations can arise out of aggressive (bad) PID tuning, bad APC (advanced process control) design, bad control valves, interaction from neighboring loops or PV signal problems. Apromon is equipped with TAD (true amplitude detection) algorithm that is the world’s best, most modern, novel and revolutionary breakthrough in the area of oscillation detection. The TAD algorithm has a powerful internal iterative procedure for automatically isolating the true oscillating wave without getting confused or skewed by the various extents of noise and medium frequency signals superimposed on the true oscillations. This capability is what distinguishes Apromon from any other competitor tool and technology. Identification of oscillations has a tremendous impact on the plant’s bottom line. Savings: $500K.
Correlated PV signals
Modern plants are highly mass-balance and energy integrated. Problems in one section of the plant can migrate problems to another section of the plant. Often plant personnel are focusing on fixing problems in the wrong area when they ought to have been focusing in the problem source area. Apromon will help in characterizing all PV signals into many frequency categories. This helps to identify the problem source and helps to pinpoint and focus improvement efforts in the correct section of the plant.
PV signal spectral frequency
Apromon has the built-in technology and algorithm for splitting a PV signal into its various signal frequencies. Apromon will identify the fast (random noise) frequencies, medium (drift and disturbances) frequencies and the slow (real process signal). Analysis of the signal frequency distribution illuminates hidden PV problems and also shows potential pairing and interactions.
PV signals close to instrument range limits
Apromon identify and flags all PV signals that are close to the instrument ranges. This list of instruments can be placed on high priority for instrument replacement or range change during the earliest planned turnaround. Instruments operating too close to range limits will be maxed out or clamped and will not display the true process values. This in turn will cause control problems and prevent the plant from being operated efficiently.
PV signal variance and standard deviation
Apromon groups all PV signals based on standard deviation and variance. High numbers for this criteria is indicative of an underlying process, equipment, instrument or interactive problem. Knowing the list of PV signals with high standard deviation and variance is the first step towards setting up efforts to find the root cause followed by a corrective action plan.
Spiky control valves
A plant can have as many as 50-5000 control valves. It is impossible for a human being to check all control valves on a regular basis. Spiky control valves can be a result of many reasons – control valve internals problem, hardware problems, excessive derivative action in the PID tuning, lack of adequate PV filtering, I/O card problems and a host of other potential issues. Apromon will identify and alert such control valves and help to prioritize the maintenance and fixing of the problem.
Control valves close to limits
It is possible for some control valves to be oversized or undersized. Valves operating under 15% or over 85% for most of the time cannot provide good control action. Apromon will identify undersized and oversized valves. This list of valves can be used by the plant’s maintenance group as a high priority item for fixing during an upcoming turnaround. Identification and fixing of such control valves has shown improvements of $500K at some chemical sites.
Hysteresis and stiction in control valves
Control valves can suffer from stiction and hysteresis. Apromon has the technology and algorithm for identifying control valves suffering from stiction and hysteresis. Stiction and hysteresis can cause bad PID control and can also impact APC quality. Stiction and hysteresis can often produce control problems that looks like caused by bad tuning. Often plant personnel spend a lot of effort on PID tuning without realizing that the control problem is not because of bad PID tuning but is because of stiction and hysteresis in the control valve. Apromon can identify the stiction and hysteresis and help plant personnel in focusing on fixing the control valve problems. Furthermore, if the control valve cannot be fixed, serviced or replaced for any reason, then PiControl has tuning technology and tune the PID with special tuning parameters to improve the control quality and compensate for a bad control valve suffering from stiction and hysteresis.
Excessive movement in control valves
Apromon can sort all control valves in the descending order of excessive movement. If a control valve is moving a lot, there could be many underlying causes and reasons, that if known and identified could surface important process, equipment, instrument and operating issues. May be the operator is changing the SP or the OP too much and too often and this may be because of a previously unknown problem that now could be examined. May be there is PV signal problem or a control valve problem. Or there could be a wrong OP characterizer or something else. Apromon can help to unearth such problems.
Control valves subject to excessive directional changes
Apromon can identify valves that are subject to high distress. Control valve distress refers to control valves that are constantly changing direction. They increase and decrease their control valve position too frequently. This leads to high wear-and-tear on the valve subsequently reducing the control valve life. Big control valves can cost as much as $50K to replace. Apromon can help to identify all control valves that are subject to high distress. Operations group then can take corrective action and improve the situation and help to lengthen the control valve life. Savings from such an effort can be $300K per year.