Menu
- Home
- Products
- Process Control Optimization
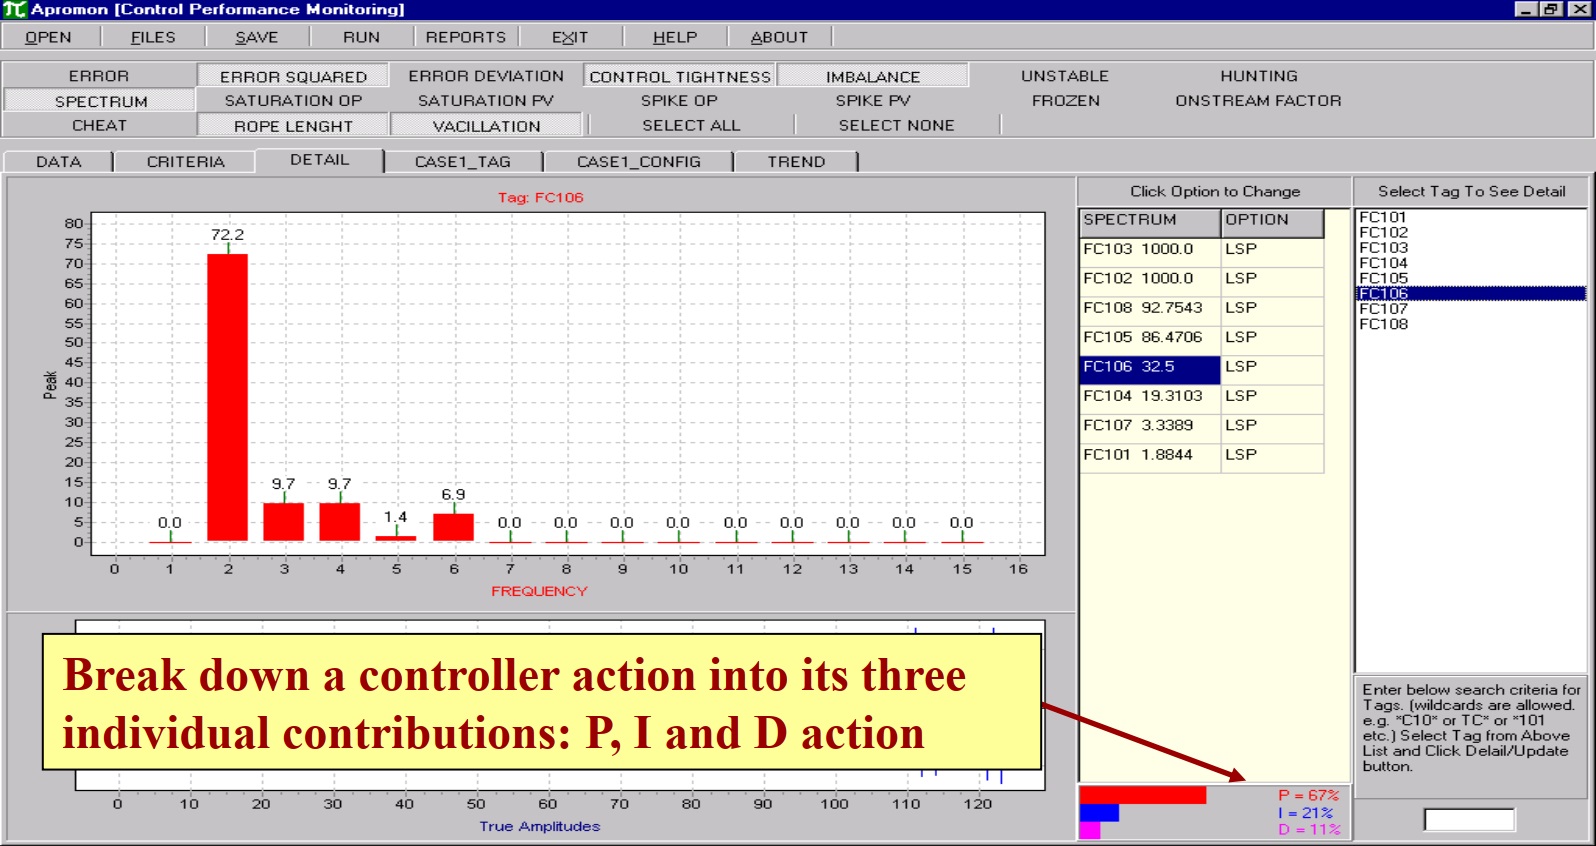
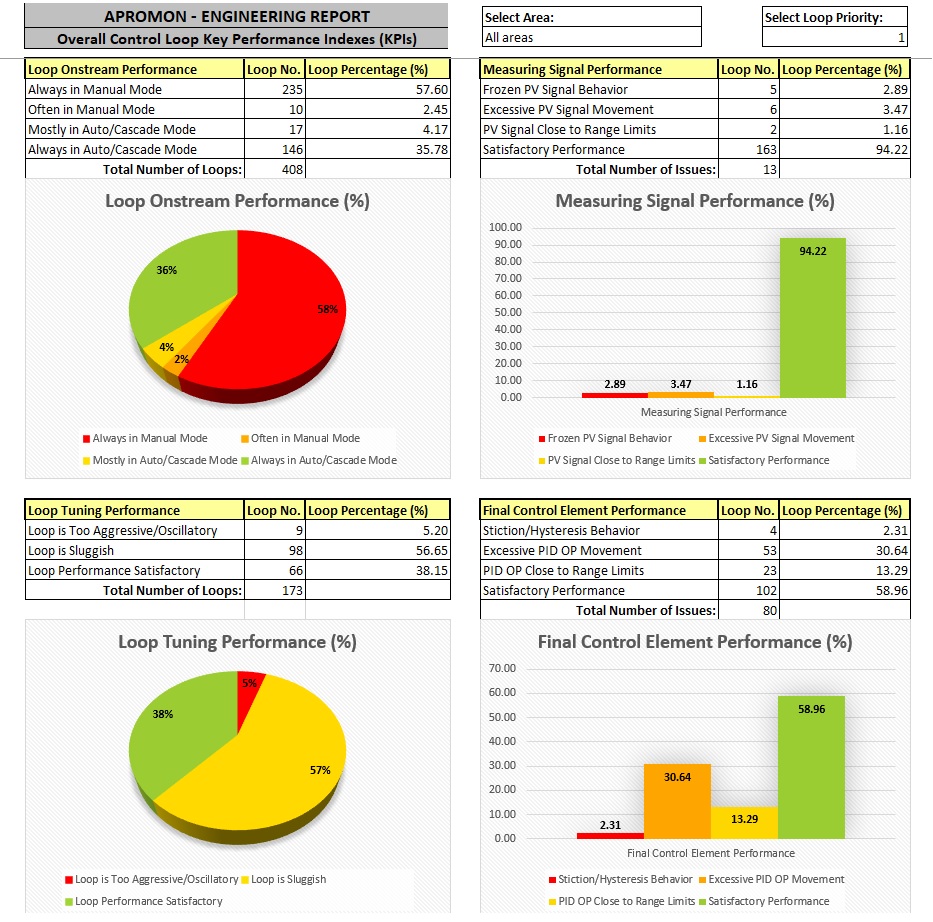
- Process Control Monitoring & Diagnostics
- Process Control Simulation
- SIMCET Real-Time PID Tuning Training Simulator
- STYROSIM Styrene Monomer Plant DCS Simulator
- PiDistill Continuous Distillation Column Simulator
- PiDistill-B Batch Distillation Column Simulator
- PiDistil-B Lite Azeotropic Batch Distillation Column Simulator
- PiReact-T Tubular Reactor Simulator
- PiReact-CSTR Continuously Stirred Tank Reactor Simulator
- PiFlow Flow Controller in Heat Exchanger Simulator
- PiLevel Level Controller in Vertical Tank Simulator
- PiTemp Temperature Controller for Heat Exchangers Simulator
- PiTemp Plus Closed-Loop Heat Transfer Simulator
- PiHEx Heat Exchanger Network Simulator
- PiDeltaP Pressure Drop Simulator
- PiPump Pump System Simulator
- PiAgitator Agitation Effect Simulator
- PiAbsorb Absorption Column Simulator
- PiDryer-Tray Tray Dryer Simulator
- PiEvap Double Effect Evaporator Simulator
- Auxiliary OPC Products
- Services
- Process Improve – Reduce Steam Consumption, Flaring, Emissions, Alarms and More
- PID Control Loop Tuning Consulting and Improvements
- MPC – Model Predictive Controller Maintenance, Consulting and Projects
- Onsite / Online Process Control Training and Education
- PLC / HMI / SCADA Design and Programming
- DCS / PLC – based Advanced Process Control (APC)
- Innovative Chemical Engineering Technology Design
- Industries
- Training
- Articles
- About
- Contact
Close