The Cooling Tower Experience Nobody Gets Enough Of – Until Now
Est. Reading: 4 minutes
The Cooling Tower Experience Nobody Gets Enough Of - Until Now 2
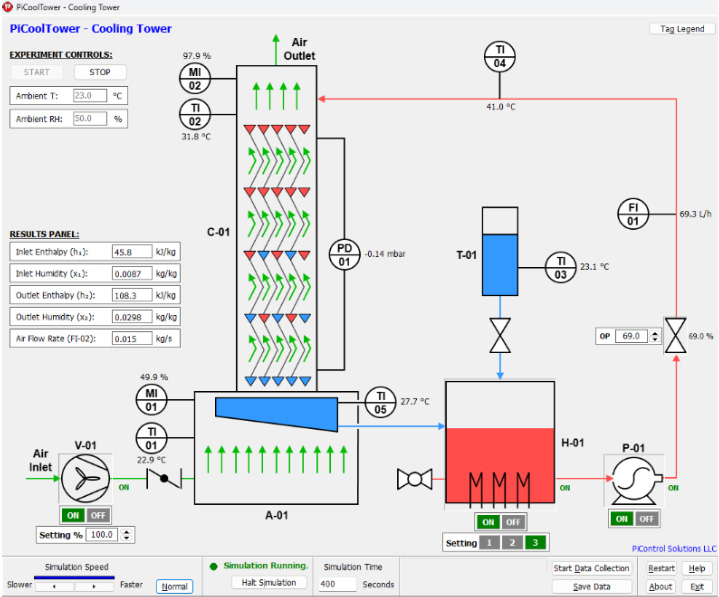
Figure 1. PiCoolTower simulator — P&ID view with live instrument readings at steady state.
The Wall Nobody Told You About in Class
Here’s a paradox most engineers never get to sit with: a cooling tower can do its best work on a mild, dry afternoon and its worst on the scorching, humid day everyone assumes it’s needed most. That’s not a design flaw — it’s a hard thermodynamic limit called the wet-bulb temperature, and no fan speed, no packing redesign, no clever retrofit lets a cooling tower push outlet water below it. Every engineer has seen the term in a textbook. Very few have ever actually watched a real tower run straight at that wall and fail to break through it.
PiCoolTower, developed by PiControl Solutions, puts that wall directly in front of you — and lets you spend as long as you want trying to push past it. It’s a real-time dynamic simulator of a horizontal counter-flow cooling tower. Adjust fan speed, water flow, and heater load from a live P&ID-style panel, and watch temperatures, humidity, and flow respond exactly as they would on running equipment, because underneath the panel, PiCoolTower is continuously solving the same psychrometric and heat-and-mass-transfer physics that governs a real tower — not just computing a single steady-state design point.
What PiCoolTower Teaches — Regardless of Your Background
The value of a simulator isn’t that it replaces calculation — it’s that it makes the results of calculation visible and immediate. Four things happen in a PiCoolTower session that a textbook problem, a datasheet, or a DCS overview screen cannot replicate:
The wet-bulb limit stops being a number on a chart
Push the fan to maximum, cut the water rate, and watch the outlet water temperature fall — right up until it meets the wet-bulb temperature set at the start of the session, and then it simply stops. That thermodynamic floor is something every engineer has seen written down; in PiCoolTower it becomes something they’ve personally tried to beat and couldn’t. For a student, that’s a genuine insight. For a working process engineer, it reframes how they think about cooling capacity margin on their own equipment. [1], [2]
Evaporation is the mechanism, not the side effect
Watch the outlet air humidity climb toward saturation during a run, and it becomes obvious that evaporation isn’t a minor loss term in a cooling tower’s energy balance — it’s carrying the overwhelming majority of the heat out of the water. That’s the realization that separates engineers who have actually operated a tower from engineers who have only ever sized one on a datasheet.[1]
Controls fight each other in ways a steady-state model never shows
Cut the water flow rate and three things move in three different directions at once. The water arriving at the tower actually gets hotter, because the same heater output is now warming a smaller stream. The percentage of the available cooling that gets recovered improves, because a lighter water stream is easier for the same air flow to chase down toward the wet-bulb limit. And the total heat the tower removes, in real terms, drops anyway, because there’s simply less water moving through it to begin with. A steady-state design calculation gives you one number for one condition. PiCoolTower shows all three of these moving live, and makes you reconcile how “more efficient” and “less effective” can both be true of the exact same valve move. [3], [2]
A perfect energy balance is itself the lesson
In PiCoolTower, the water-side and air-side energy balances close perfectly, because the underlying physics is internally consistent. On a real tower, they never quite do — piping losses, instrument placement, and measurement uncertainty see to that. Engineers who have first watched the balance close perfectly in simulation are far better equipped to recognize, and question, exactly where and why a real tower’s numbers don’t add up. [3], [4]
One Simulator, Three Different “Aha” Moments
A student running PiCoolTower for the first time stops treating the wet-bulb temperature as an exam term and starts treating it as a wall they just personally hit.
A process engineer scoping a new cooling circuit gets to test an operating point before it’s poured in concrete, not after.
A controls engineer tuning a real cooling loop gets to break something on purpose, somewhere it’s actually safe to break it.
Three very different reasons to open the same simulator — and none of them require a shared physical tower, a two-hour lab slot, or a plant trial to get there. Ambient temperature and humidity are fully reconfigurable at start-up, so the same installation can model a muggy summer afternoon or a bone-dry winter day without touching a line of code.
Conclusion
Cooling towers hit a hard thermodynamic wall every day they run, and carry an enormous amount of engineering trust from people who have never actually watched them try. That trust deserves to be backed by real operating intuition, not a design calculation performed once and filed away. PiCoolTower builds exactly that intuition: the thermal and dynamic behavior that governs how a real tower responds, in real time, to every control decision made around it — including the wall it can never quite break through.
To request a demonstration of PiCoolTower and the full PiControl laboratory simulator portfolio, contact info@PiControlSolutions.com or visit www.picontrolsolutions.com.
References
1. McCabe, W.L., Smith, J.C., and Harriott, P., Unit Operations of Chemical Engineering, 7th ed., McGraw-Hill, 2005, Chapter 12: Humidification Operations.
2. Perry, R.H. and Green, D.W. (Eds.), Perry’s Chemical Engineers’ Handbook, 9th ed., McGraw-Hill, New York, 2019, Section 12: Psychrometry, Evaporative Cooling, and Solids Drying.
3. Treybal, R.E., Mass-Transfer Operations, 3rd ed., McGraw-Hill, New York, 1980, Chapter 12: Cooling Towers.
4. ASHRAE Fundamentals Handbook, American Society of Heating, Refrigerating and Air-Conditioning Engineers, 2021, Chapter 1: Psychrometrics.