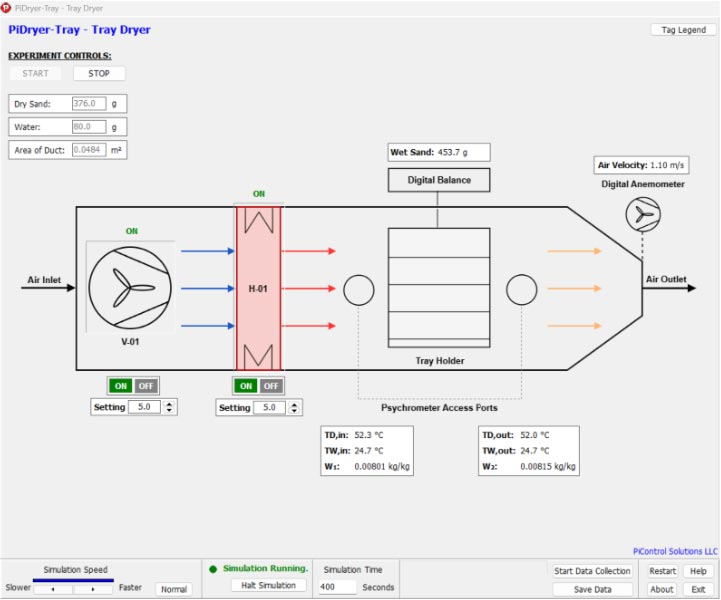
PiDryer-Tray is an advanced, interactive chemical engineering simulator that models a convective tray dryer in real time. The simulator replicates the behaviour of a bench-scale pilot tray dryer in which ambient air is drawn by a centrifugal fan, heated by an electric resistance heater, and directed across a tray of wet granular material. As moisture evaporates from the sand surface, a digital balance continuously reports the wet sand mass — tracing the complete drying curve from the constant-rate period through the falling-rate period as it occurs.
Users control three primary variables — fan speed, heater setting, and initial sand loading — and observe immediate effects on inlet and outlet dry-bulb and wet-bulb temperatures, humidity ratios, air velocity, and the Wet Sand mass trend. All psychrometric calculations use the ASHRAE energy-balance wet-bulb method, which correctly handles the large dry-to-wet-bulb temperature depressions that occur when heated air at 50–60 °C contacts a wet surface near 25 °C — conditions where simpler empirical formulas lose accuracy by several degrees.
Developed by PiControl Solutions LLC, PiDryer-Tray supports courses in heat and mass transfer, drying operations, psychrometrics, and process control at universities and colleges worldwide. It runs equally well as a standalone desktop training tool for process engineers and technicians working with industrial drying equipment.

Physics engine updates every simulation second. All instruments respond dynamically to changes in fan speed and heater setting, just as on real pilot-scale equipment.
Wet-bulb temperatures before and after the tray are computed from the ASHRAE energy-balance formula, which is accurate at elevated inlet temperatures where simpler empirical formulas overestimate the wet-bulb reading by several degrees.
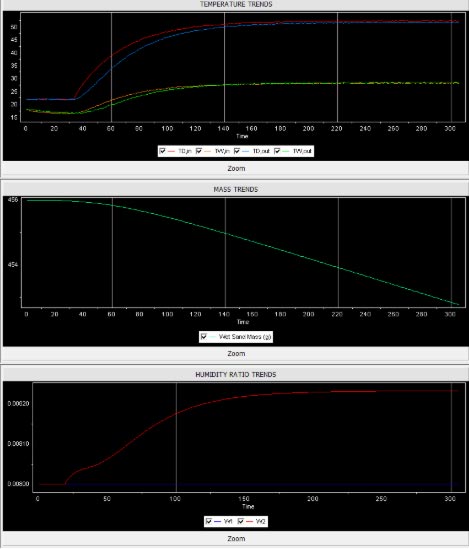
The Wet Sand mass trend plots balance readings vs. simulation time in real time. The slope of the trend at steady state is the evaporation rate. Users observe the transition from constant-rate to falling-rate drying directly on screen.
Thermal power output follows a square-root relationship with the dial setting — at setting 5.0 the heater delivers approximately 70% of maximum power, not 50% as a linear model would predict. This matches the behaviour of phase-angle controlled resistance heaters in pilot-scale and industrial equipment.
Higher fan speed increases air mass flow rate and drying capacity but simultaneously reduces the temperature rise for a given heater setting. This trade-off — observable in real time — develops quantitative intuition about coupled process variable interactions.
Dry-bulb and wet-bulb temperatures are displayed before and after the tray, together with computed humidity ratios. Air velocity at the duct outlet enables direct calculation of air mass flow rate.
Dry sand mass, initial water mass, and duct cross-sectional area are entered before the simulation begins, setting the initial moisture content and the air flow geometry for the entire run.
Separate scrolling chart panels display time-histories of all four temperatures and the Wet Sand mass trend. Charts can be zoomed for detailed inspection of drying transients and steady-state slopes.
All process variables are logged at every simulation step and exported to a comma-separated values (CSV) file for post-processing in Excel, MATLAB, or Python.
Heater maximum power, efficiency, power-law exponent, drying rate coefficient, fan time constant, and ambient conditions are stored in a plain-text INI file, allowing instructors to recalibrate the model to match their equipment or course objectives.
Installs and runs entirely on a Windows PC. No licence server, no cloud dependency, and no user data ever leaves the local machine.
The main window displays a P&ID-style process diagram of the tray dryer system. Fan and heater controls open individual panels where speed and power level are set. All instrument readings update every simulation second.
PiDryer-Tray continuously logs and plots key process variables. Real-time scrolling trend charts are provided for:
All data can be exported to a CSV file at any time. The export includes a timestamped header and columns for each instrument tag, making it straightforward to import into Excel, MATLAB, or Python for moisture content calculations, drying curve analysis, and mass balance closure.
Visualise and experiment with convective drying theory, psychrometrics, and heat and mass transfer. Observe the complete drying curve — constant-rate period, critical moisture content, and falling-rate period — without access to physical laboratory equipment.
Use the simulator for preliminary exploration of dryer operating conditions, heater power requirements, and air flow rate trade-offs before implementing changes on process equipment. Validate mass and energy balances against instrument readings without production risk.
Design structured experiments around drying rate calculations, psychrometric chart verification, mass balance closure, and heater nonlinearity — or demonstrate live how fan speed and heater setting interact to determine the inlet air condition and drying rate.
Validate drying kinetics models, explore heat and mass transfer coefficient sensitivity, and generate synthetic steady-state and transient datasets for comparison with experimental drying curve data.
Industrial tray dryers involve high-temperature surfaces and hygroscopic materials. PiDryer-Tray eliminates all associated risks while preserving the full learning value of the drying curve, psychrometric analysis, and mass balance experiments.
No equipment, consumables, or maintenance costs. A single software licence supports an entire class of users simultaneously.
Users can reset the simulator instantly and repeat startup procedures or steady-state experiments as many times as needed — impossible on shared physical equipment with limited laboratory time slots.
Runs on any Windows PC. Users can continue their work at home, in the library, or remotely — making it fully compatible with hybrid and online delivery formats.
The plain-text INI configuration file lets instructors adjust heater power, drying rate coefficient, fan time constant, and ambient conditions to create different operating scenarios without modifying source code.
Simulates a process operator station experience — fans, heaters, trend charts, and CSV data export — preparing users for the digital control environments found in pharmaceutical, food processing, agricultural, and specialty chemical drying operations.
Operating system: Windows 10 or Windows 11 (64-bit). Processor: any modern x86-64 CPU. Memory: 512 MB RAM minimum; 2 GB recommended. Storage: 50 MB for the installed application and configuration files. Display: 1280×800 minimum resolution; 1920×1080 recommended. No internet connection, no administrator privileges, and no additional runtime installations required.
Request a demo, ask about pricing, or schedule an online walkthrough.