PiControl Solutions
Menu

PiCoolTower

Request More InFo

Real-Time Wet Cooling Tower Simulator

Experience evaporative cooling and wet-bulb thermodynamics in real time — purpose-built for chemical engineering education, process training, and research.

info@PiControlSolutions.com, Tel: (832) 495-6436

Click on Schedule a Demo to download and to examine a full-blown demo of PiCoolTower.

Schedule A Demo

Overview

PiCoolTower is an advanced, interactive chemical engineering simulator that models a horizontal counter-flow wet cooling tower in real time. The simulator replicates the behaviour of a bench-scale cooling tower in which hot process water is cooled by direct contact with ambient air — one of the most widely used heat rejection operations in the chemical process, power generation, and HVAC industries. The primary cooling mechanism is evaporation: a fraction of the water evaporates into the air stream, carrying away latent heat and cooling the remaining liquid to within a few degrees of the ambient wet-bulb temperature.

Users manipulate three independent controls — fan speed (V-01), water flow valve (HV-01), and heater power level (H-01) — and observe the immediate effects on water outlet temperature, air outlet humidity, cooling efficiency, and evaporation rate. All process variables update continuously, giving the feel of operating a real instrument panel rather than running a static textbook calculation.

Developed by PiControl Solutions LLC, PiCoolTower is used by universities and colleges to support courses in heat and mass transfer, psychrometrics, unit operations, and process control — and can run equally well as a standalone desktop application or as part of a virtual laboratory.

Schedule A Demo

Key Features

  • Real-Time Simulation: Physics engine updates every second. All instruments respond dynamically to control changes, just as in a physical laboratory.
  • Enthalpy-Based Air Outlet State: Air outlet temperature TI-02 and relative humidity MI-02 are derived from a full enthalpy and mass balance rather than empirical approximations, ensuring thermodynamic consistency between the water-side and air-side energy balances.
  • Complete Psychrometric Calculations: Inlet and outlet humidity ratios (x₁, x₂), specific enthalpies (h₁, h₂), and inlet wet-bulb temperature are computed live from TI-01, MI-01, TI-02, and MI-02 using ASHRAE psychrometric equations — values students would otherwise read from a psychrometric chart.
  • Three Independent Controls: Fan speed (V-01, 0–100%), water flow valve (HV-01, 0–100%), and heater power level (H-01, Off / Level 1 / 2 / 3) allow full exploration of cooling tower operating characteristics and their effect on efficiency and evaporation rate.
  • Full Instrument Set: Five temperature transmitters (TI-01 to TI-05), two humidity transmitters (MI-01, MI-02), one differential pressure transmitter (PD-01), and two flow indicators (FI-01, FI-02) — 10 live readings in total, matching the physical control panel layout.
  • Startup Configuration Screen: Ambient dry-bulb temperature and relative humidity are entered before the simulation begins, setting realistic initial conditions for any climate or laboratory location.
  • Cooling Tower KPIs: Cooling efficiency η = (T₄ − T₅) / (T₄ − Tᵂᵇ,in) × 100% and evaporation rate mₑᵛₐₚ = mₐᵢᵣ × (x₂ − x₁) are computed and displayed in real time.
  • Real-Time Trend Charts: Separate chart panels display time-histories of all key process variables. Charts scroll automatically and can be zoomed for detailed transient analysis of startup dynamics and disturbance responses.
  • Data Logging & CSV Export: All process variables are logged at every simulation step and exported to a comma-separated values (CSV) file for post-processing in Excel, MATLAB, or Python.
  • Configurable INI File: Heat and mass transfer coefficients, NTU parameter, valve characteristics, heater power levels, and psychrometric constants are stored in a plain-text INI file, allowing instructors to recalibrate the model without recompiling the software.
  • No Internet Connection Required: Installs and runs entirely on a Windows PC. No licence server, no cloud dependency, and no user data ever leaves the local machine.
  •  
Schedule A Demo

Process Diagram & Instruments

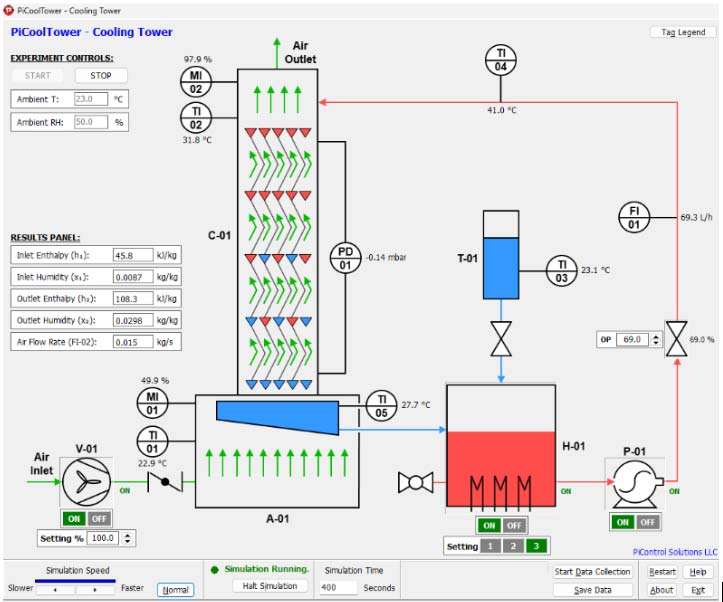
The main window displays a P&ID-style process diagram of the cooling tower system. Each instrument tag corresponds to a live measurement; valve positions and fan speed are adjusted with on-screen controls. A startup configuration screen allows ambient temperature and relative humidity to be set before the simulation begins.

Tag

Description

Unit

Typical Range

V-01

Fan speed (radial fan)

0 – 100

H-01

Heater power level

Off / L1 / L2 / L3

HV-01

Water flow control valve

%

0 – 100

P-01

Circulating water pump

ON/OFF

TI-01

Air inlet dry-bulb temperature

°C

15 – 35

TI-02

Air outlet dry-bulb temperature

°C

25 – 45

TI-03

Supply tank temperature

°C

15 – 35

TI-04

Water inlet temperature

°C

35 – 52

TI-05

Water outlet temperature

°C

22 – 32

MI-01

Air inlet relative humidity

%

20 – 80

MI-02

Air outlet relative humidity

%

92 – 99

PD-01

Air inlet differential pressure

mbar

−0.06 to −0.18

FI-01

Water volumetric flow rate

L/h

0 – 100

FI-02

Air mass flow rate

kg/s

0 – 0.025

x₁

Inlet air humidity ratio

kg/kg

0.005 – 0.020

x₂

Outlet air humidity ratio

kg/kg

0.020 – 0.040

h₁

Inlet air specific enthalpy

kJ/kg

30 – 55

h₂

Outlet air specific enthalpy

kJ/kg

85 – 130

PiCoolTower main process diagram
Figure 1. PiCoolTower main process diagram — P&ID view with live instrument readings.

Real-Time Trends & Data Export

PiCoolTower continuously logs and plots key process variables. Real-time scrolling trend charts are provided for:

  • Temperatures: TI-01 (air inlet), TI-02 (air outlet), TI-04 (water inlet), TI-05 (water outlet)
  • Humidity: MI-01 (air inlet), MI-02 (air outlet)
  • Differential pressure: PD-01
  • Flow rates: FI-01 (water volumetric), FI-02 (air mass flow)

All data can be exported to a CSV file at any time. The export includes a timestamped header and a column for each instrument tag, making it straightforward to import into Excel, MATLAB, or Python for further analysis, psychrometric chart verification, and comparison against theoretical energy and mass balance calculations.

Target Audience

  • Chemical Engineering Students:  Visualise and experiment with wet-bulb thermodynamics, evaporative cooling theory, and heat and mass transfer studied in unit operations, psychrometrics, and process control courses. Calculate cooling efficiency and evaporation rate from live readings — no physical equipment required.
  • Process Engineers & Technicians:  Use the simulator for preliminary exploration of cooling tower performance at different ambient conditions, fan speeds, and water flow rates before implementing changes on real plant.
  • Educators & Instructors:  Design structured experiments around cooling efficiency, evaporation rate, energy balance closure, and psychrometric chart reading — or demonstrate live how wet-bulb temperature sets the thermodynamic limit for outlet water temperature.
  • Researchers:  Validate heat and mass transfer correlations, explore NTU-effectiveness model parameters, and generate synthetic steady-state and transient datasets for comparison with experimental data.

Benefits

  • Hands-On Without the Hazards:  Cooling tower experiments involve hot recirculating water and aerosol generation. PiCoolTower eliminates all associated risks while preserving the full learning value of a real startup, steady-state run, and disturbance experiment.
  • Cost-Effective:  No equipment, consumables, or maintenance costs. A single software licence supports an entire class of users simultaneously.
  • Flexible & Repeatable:  Users can reset the simulator instantly and repeat startup procedures or steady-state experiments as many times as needed — impossible on shared physical equipment with limited laboratory hours.
  • Accessible Anywhere:  Runs on any Windows PC. Users can continue their work at home, in the library, or remotely — making it ideal for hybrid and online delivery.
  • Instructor Customisable:  The plain-text INI configuration file lets instructors adjust heat transfer coefficients, NTU parameters, heater power levels, and valve characteristics to create different operating scenarios without modifying source code.
  • Industry 4.0 Ready:  Simulates a process operator station experience, preparing users for the digital control environments found in modern power plants, refineries, chemical manufacturing, and HVAC management systems.

System Requirements

Component

Requirement

Operating System

Windows 10 or Windows 11 (64-bit recommended)

Processor

1 GHz or faster (Intel / AMD)

Memory

512 MB RAM minimum; 2 GB recommended

Display

1280 × 720 or higher resolution

Storage

50 MB free disk space

Additional Software

Microsoft Visual C++ Redistributable (included in installer)

Internet Connection

Not required for normal operation

Available Documentation

  • User Manual:  Step-by-step guide to all simulator features: startup configuration screen, process diagram overview, startup procedure, steady-state operation, real-time trends, CSV data export, and INI configuration reference.
  • Case Study:  Guided laboratory tasks covering cooling tower efficiency, evaporation rate, energy balance verification, psychrometric chart comparison, and dynamic disturbance response — with startup procedures, data tables, calculation templates, Excel model guide, and discussion questions.
  • Configuration Reference:  Description of every parameter in PiCoolTowerConfig.INI with units, default values, physical basis, and guidance for customisation.

Get PiCoolTower

Request a demo, ask about pricing, or schedule an online walkthrough.

Phone:  (832) 495-6436

Email:  info@PiControlSolutions.com

Website:  www.picontrolsolutions.com


magnifiercrossmenu